How to monitor Efergy sensors with Zabbix
21st August 2019Efergy offers power consumption monitoring sensors and as an owner of an Engage Hub Kit i wanted to monitor the home wattage from a central screen.Their cloud platform is nice but at some point you just stop logging in or checking your phone, and since i have Zabbix as a central monitoring and notification dashboard for my network i wanted to include my Efergy sensor.
Energyhive has their compatible api published so we dont need to rely on Efergy’s platform exclusively.
Prerequisites and process outline
- Own an Engage Hub Kit,efergy account and access to efergy cloud
- Zabbix version 3.2.6 installed (should work on later versions too)
- Create a Token from their platform
- Create a script that calls their api and fetches Watt utilisation
- On Zabbix make a template for efergy sensor, create an external check and a trigger for high usage,make a host for the sensor and include in a services/network map
Step 1: Create the script
Login to Efergy cloud platform and create a token from the settings tab:
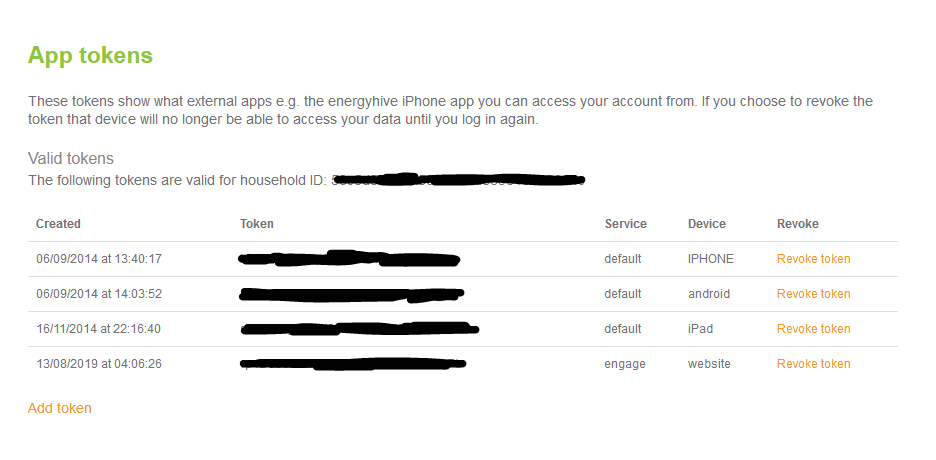
We’ll use that token so our script can access the sensor and pull our current consumption.First we need to check the API from the test webpage of energyhive.
Go to http://www.energyhive.com/content/about/develop and paste the token on the Your App Token: box. For my engage hub kit only the two first options are supported and i want to visualize the first, Instant Readings (Watts/lx/deg C). Press the try option to get the API call url and our data as JSON:
http://www.energyhive.com/mobile_proxy/getCurrentValuesSummary?token=xxxxxxxxxxxxxxxxxxxxxxxxxxxxxxxxExample JSON result:
[{"cid":"PWER","data":[{"1565759027010":496}],"sid":"642158","units":"W","age":3}]Login to the Zabbix Host and create a script on /usr/lib/zabbix/externalscripts:
nano /usr/lib/zabbix/externalscripts/efergyPaste the script and replace the xxxx portion with your token:
#!/bin/bash
W="$(curl -s 'http://www.energyhive.com/mobile_proxy/getCurrentValuesSummary?token=xxxxxxxxxxxxxxxxxxxxxxxxxxxxxxxx')"
echo "$W" |  sed 's/:/ /g' | cut -f4  -d' ' | cut -f1 -d'}'
Make the script executable and change owner to zabbix user:
sudo chmod +x /usr/lib/zabbix/externalscripts/efergysudo chown zabbix:zabbix /usr/lib/zabbix/externalscripts/efergyFor clarity below is a breakdown of the script:
This script uses curl with -s (silence) option to supress the download stats output.We need only a single watt value so zabbix can understand a numeric decimal value.What we get if we just run the curl portion of the command in the cli is similar to
[{"cid":"PWER","data":[{"1565759027010":496}],"sid":"642158","units":"W","age":3}]
The bold number in the JSON output is our current Watt value, so we need to get rid of the extra information.Inside the script we include the curl command in a variable, and in the third line we pipe the sed and cut native commands and output the result.Specifically sed is used to substitute : character with a single space .We want the spaces to separate the fields, so the script pipes two cut commands.Select field 4 and set as delimiter the spaces, producing 496}],”sid” , and then select field 1 (the only field left) and set as delimiter character } , producing a single value 496 which is the current wattage.
echo "$W" | sed 's/:/ /g' | cut -f4 -d' ' | cut -f1 -d'}'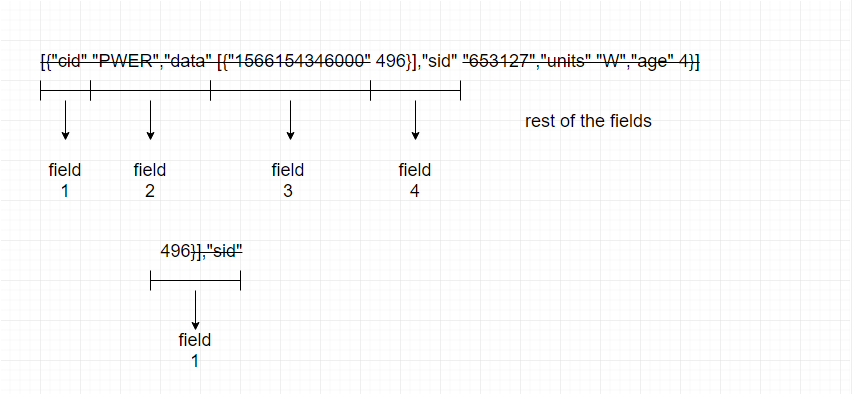
Step 2: Create a template
Regardless of the way we receive data, be it an external script or a zabbix agent feeding the server, the core process of visualizing data to Zabbix consists of creating a template and applying this template to a host.
Although we can create a zabbix item directly on a host, for efficiency reasons its best practice to apply templates to our hosts.The sensor template will include an item that receives the value of the script and a trigger that alerts on high energy usage.
On the Zabbix dashboard go to Configuration -> Templates -> Create template .
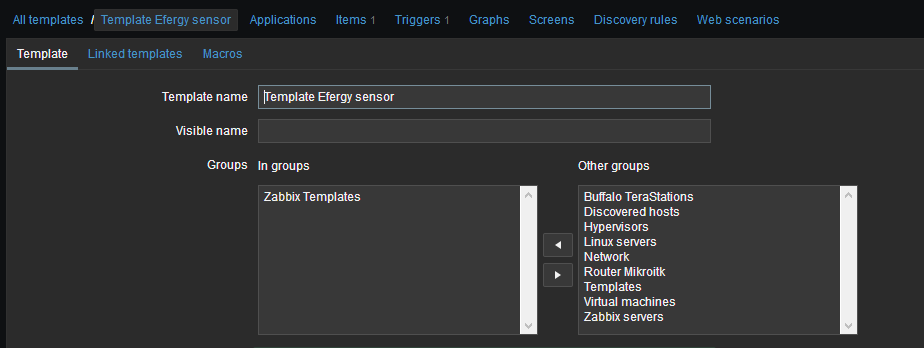
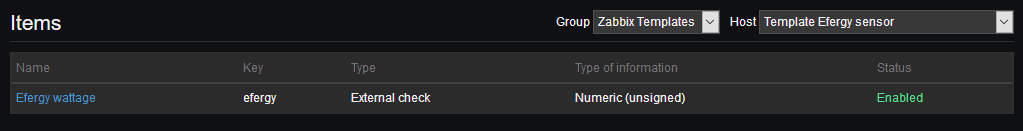
Insert a distinct name and choose a group you prefer.Next on the Items tab click Create item:
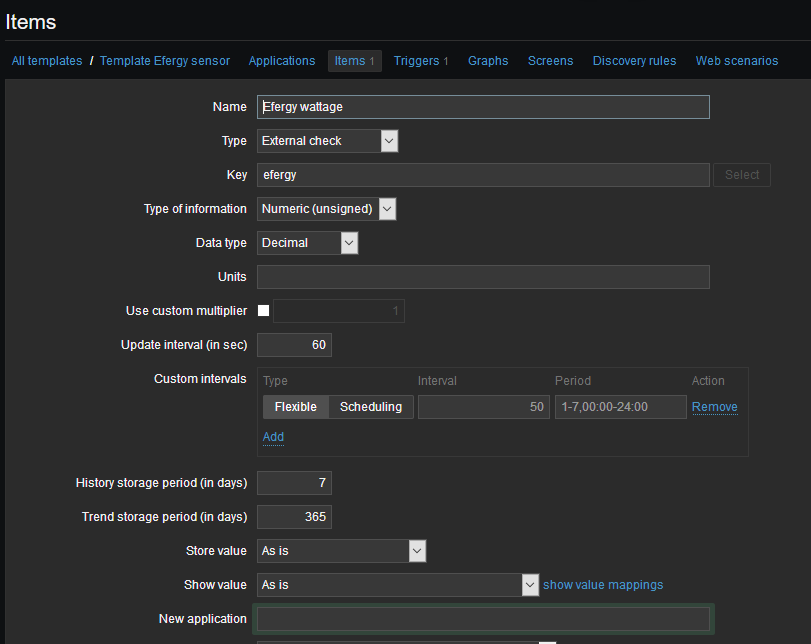
- Type: External check, Zabbix executes the script placed in the /externalscripts directory.
- Key: Must be the name of the script.
- Update interval (in sec): The interval for Zabbix to run the script.Not very wise to have a very low value as this will produce an unnecessary large amount of data.
- History storage period: How many days to store collected values in Zabbix database.
- Trend storage period: How many days to keep the average max/min/avg/total of every value after the History period is over.In this example, 60 values/h in the 8th day will become 1 value.It offers great compression of data without losing too much detail.
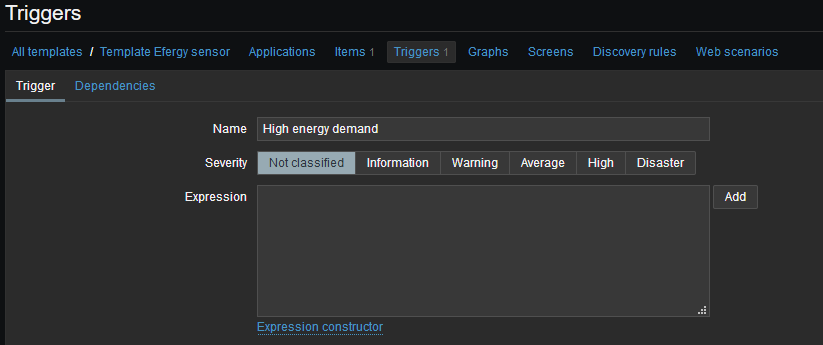
Tick Enabled at the bottom of the page and Add. Now go to the Triggers tab, hit Create trigger and enter a name for the trigger, it can be the notification msg we wish to see in the map:
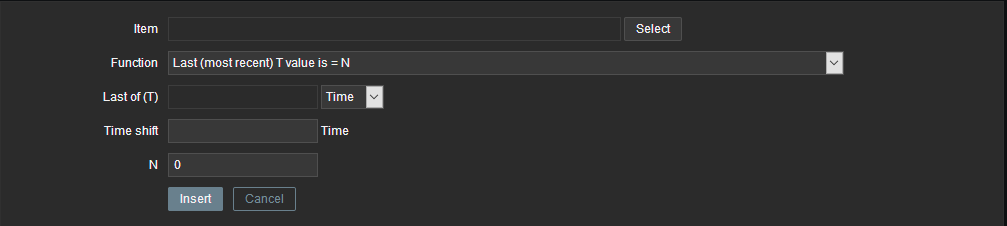
Press Add and on the pop up press Select to choose the Item we just created, the trigger will be based on the values of that Item:
We want to be notified when the value returned by the script exceeds 900 Watt:
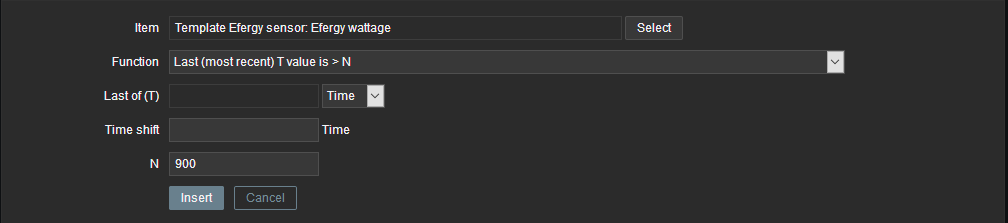
Press Insert,select a Severity( the color chosen will be represented on the map) tick Enabled and Add:
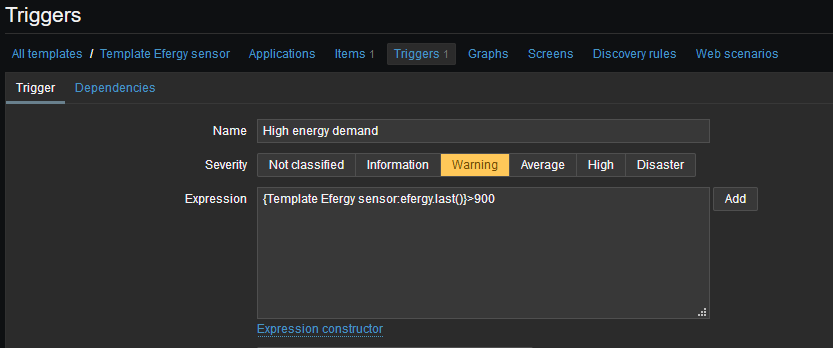
The Trigger Expression functions gives many more options, for example instead of the last value received we can set it to fire up if it is consistently above 900 Watt for 5 minutes etc.
In order to monitor the history of gathered data from a centralized point,e.g from the Monitoring -> Screens tab, a graph can be added quite easily in the Template.The graph can be added at a later time though, since Zabbix plots a graph from the gathered data by default, accesible from the Monitoring -> Latest data tab.
Our Efergy sensor template is ready, now we need to create a Host and apply the template.
Step 3: Create a Host
A Host for the Efergy sensor will be created to represent the Watt values in the Zabbix map.
Contrary to the usual network or server devices, the sensor host won’t need an IP address or a zabbix agent interface to define in the host settings, we just need a place for the values fetched from the sensor and a separate icon in the map.We can always add the template to an existing host/device and skip this step, but the possibility of a mess in the future is high (deleting the host and forgetting that we gather data for an unrelated sensor), plus the values in the map will not be in a separate icon.
On the Zabbix dashboard go to Configuration -> Hosts -> Create host:
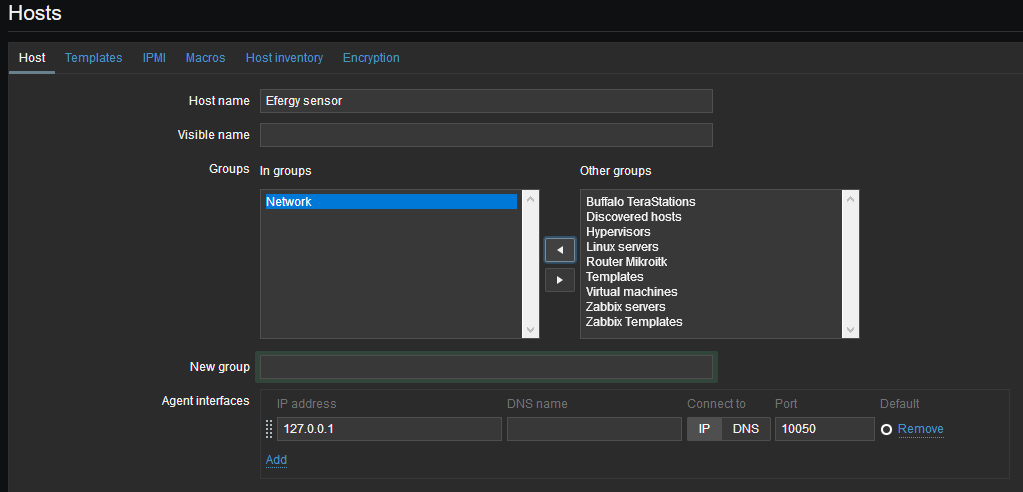
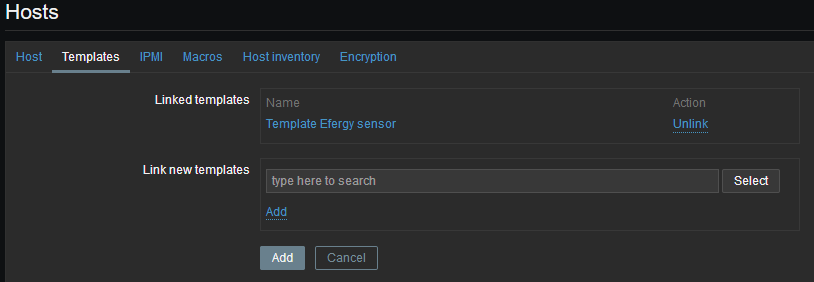
Write a name for the host,select a group of devices and leave the rest blank.Go to Templates tab, hit Select and choose the template from the previous step, press Add on the Link new templates box. The Template Efergy sensor will appear in the Linked templates, press Add at the bottom of the page:
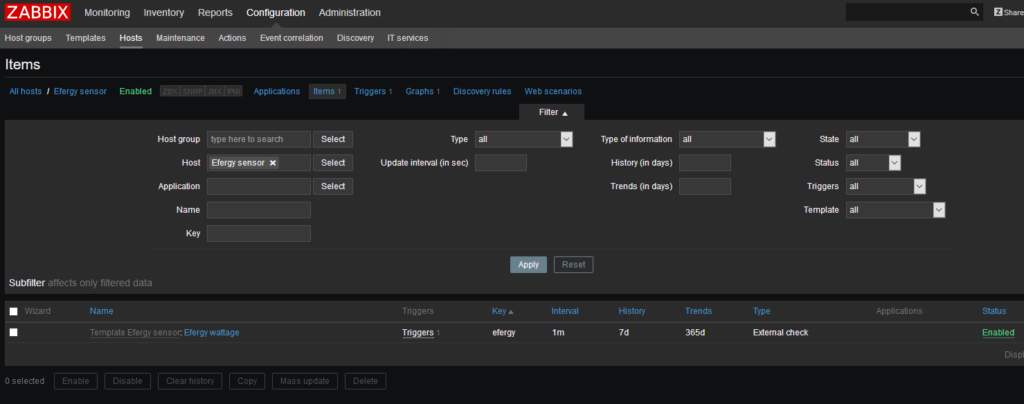
The host has been created, and after a couple of minutes depending on the interval of the Item – script we setup previously we should see our first data populating our host in the Monitoring -> Latest data tab.If there is no error in the data gathering, the status on the host configuration should be a green Enabled:
Step 4: Visualize Energy Usage on Zabbix Maps
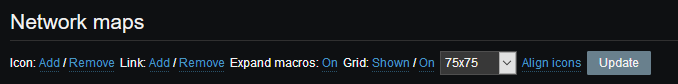
Go to Monitoring -> Maps tab and either edit an existing map or create a new one. The specifics of creating a map is left out from this guide, details for all versions can be found here.
On our map we need to add a new element for our sensor.Press Icon:Add and place the default icon in a free spot on the map.Left click on the element to edit its properties:
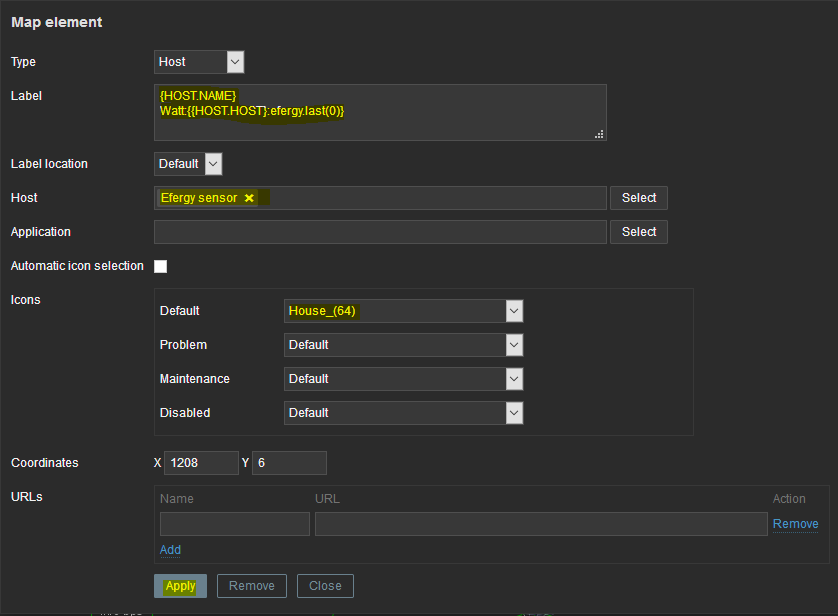
- Host:Select the Efergy sensor host created previously.
- Icons:Choose the icon for the default state of the sensor.On the Problem option the default setting means it will change to the color we selected on trigger,in this case yellow.
- Label: A series of macros,keys and functions that will print out on the map.
On the Label box paste the following :
{HOST.NAME}
Watt:{{HOST.HOST}:efergy.last(0)}
Zabbix has native and user made macros,key items and functions.The first line contains a Zabbix {HOST.*} macro.If we input {HOST.NAME} it will print on the map the hostname of the host we selected on the Host field.
The second line contains four fields.The first is just a user input,e.g the measurement unit we want to see.The rest of the fields prints out collected data.
Specifically we want the latest value received so we use the function last(0).Other examples can be avg(5m) or avg(300) which gives the average value for the last 5 minutes.This function applies to our script, the Key efergy we defined earlier.Lastly, this value is about the HOST only, so instead of typing exactly the name Efergy sensor we just use the macro {HOST.HOST},useful for pasting a big amount of host functions or for automation etc.
All available macros can be found here.
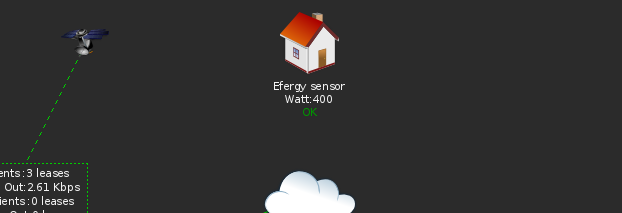
Finally we can hit Apply and Close on the element popup.Our sensor is ready and if Zabbix has already collected data we have a result.Hit Update and check the map.
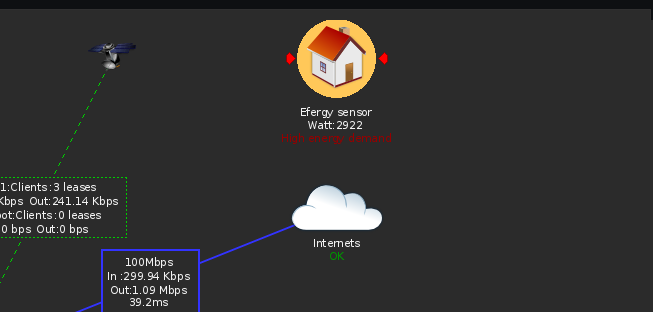
Trigger fires up
Conclusion
This is a simple use case for what Zabbix can do.At some point there will be guides about link utilization,per service resource utilization, automatic service restart or commands executed from the dashboard.Nevertheless the script procedure, macros, functions and keys presented here can serve as a starting point for more advanced implementations.
Inspiration:
https://www.domoticz.com/forum/viewtopic.php?t=6177
![]()